Kubernetes the Right Way: Observability With OpenTelemetry Collector
OpenTelemetry Collector can play a big role in ensuring your Observability data pipelines work well in large microservices deployments, especially on Kubernetes.
Read on Medium (opens in a new tab)
Since its inception a few years back, OpenTelemetry has been gaining momentum throughout the industry in observability, and more and more heads are being turned towards it. The framework itself has many best practices built into it, and it offers some generic built-in capabilities that can work with many popular observability providers and libraries. If you are interested in reading more about OpenTelemetry, I have written an article on why you should adopt it (opens in a new tab), explaining all the advantages.
OpenTelemetry Collector stands out among the many powerful features of OpenTelemetry, as an essential component that can perform many vital functions for you, especially if you are deploying your applications in Kubernetes Clusters.
Based on my experience as a Leader for the team implementing Observability functionalities for a SaaS product, I am compiling this article based on my thoughts and experience with it.
Deployment Patterns
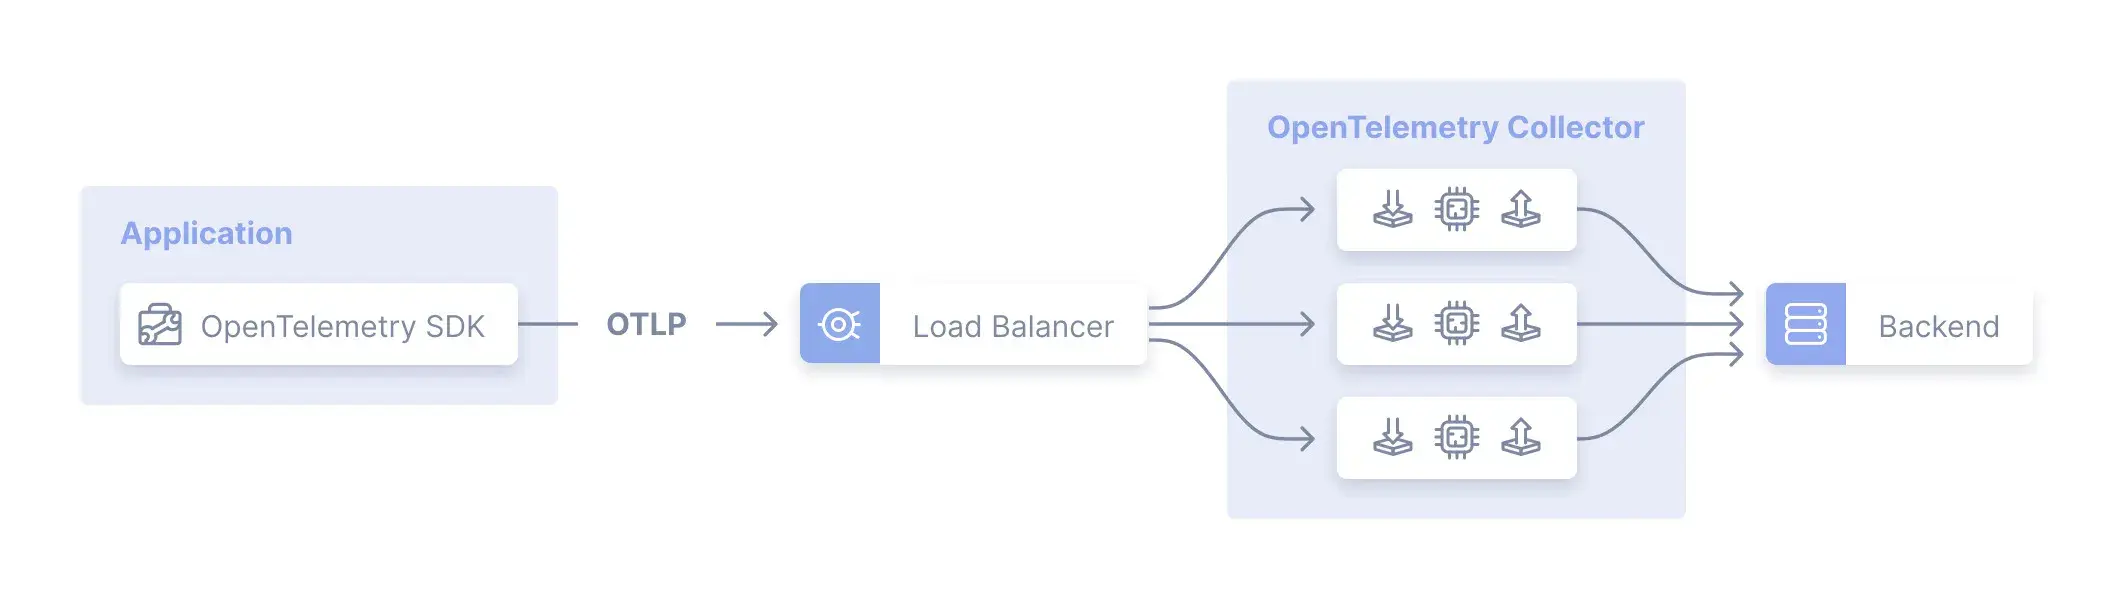
OpenTelemetry Collector can be deployed in two ways; Agent (one instance running alongside each application/microservice) and Gateway (one instance for the whole cluster). While there are some benefits of Agent pattern, it does not offer enough benefits compared to the overhead it adds. In this article, we will mainly focus on the Gateway pattern and the benefits of including it in your Kubernetes cluster.
Filter, Aggregate, and Encrypt Centrally
By using Processors and Connectors, you can easily perform many post-processing functionalities within an OpenTelemetry Collector. There are many built-in processors which allow you to perform common tasks on your data with only a few lines of configurations. You can think of this as a stream processor specifically designed for observability data.
With these capabilities, you can perform many actions such as filtering, transforming, encrypting, and anonymizing data. Since this is a vendor-agnostic way of processing your data, you will have the freedom to choose any provider of your choice and at the same time have all the advantages of a stream processing pipeline for your observability data.
Tail Sampling
Have you ever had to choose between reducing the amount of tracing data and capturing as much information so that important traces (for example errors or latency spikes) are captured in them? The answer to this dilemma is Tail Sampling. Tail Sampling allows you to sample your traces after recording the data by looking at all or most of the spans in a trace. In this way, your sampling decisions can be more informed making your final stored data more relevant.
Most of the tail-based samplers available today are implemented within the vendor's infrastructure and you will be locked into these vendors once you buy into them. Also, it is impossible to achieve this without a central entity processing the data.
However, OpenTelemetry also provides a tail-based sampler that can be configured in your OpenTelemetry collector. It does require some special considerations such as making sure one trace ends up in the same Collector, especially if you are using multiple replicas of the Collector to process your data using a trace ID or Service Aware load balancer (as you may have guessed, it is also provided by OpenTelemetry).
With all of these out-of-the-box components, you can implement your tail-based sampling strategy to reduce costs and at the same time have the relevant traces stored in preparation for any issues you may encounter.

Retry and Batch
There could be numerous data publishing failures due to reasons such as network issues or observability provider downtimes. Most of these are intermittent failures that can be solved using retries and batching.
While these could be done by the microservices themselves, it is an overhead on memory and CPU, which could be overloaded to a different component in the cluster. The OpenTelemetry Collector can step in here and handle retries and batch data for the whole cluster in one place, reducing the burden on the services.
Receive Data From Different Frameworks
OpenTelemetry Collector also supports receiving data from other frameworks/formats such as Prometheus, OpenCensus, Zipkin, and Jaeger. This allows you to migrate your services one by one to OpenTelemetry if you are in a brownfield scenario.
You can even use the OpenTelemetry Collector if your cluster contains different components using different Observability frameworks to centrally process your data and publish it to a common Observability vendor.
Publish to Many Different Observability Providers
OpenTelemetry Collector also supports using exporters to publish your data to many different observability providers after processing them. You can maintain the tokens and other configurations related to publishing within the Collector deployment without requiring all your services to directly authenticate with the providers.
This capability, combined with the ability to receive data from different frameworks and process them, allows you to use the OpenTelemetry Collector as a vendor-agnostic integration engine as well as a Stream Processor for your Observability data.
You can even publish your data to other OpenTelemetry Collectors and implement fan-out and fan-in architectures to process your data in a scalable manner.
Extensible Architecture
If all of this is reason enough for you to use the OpenTelemetry Collector, it even allows you to extend the capabilities of the Collector by writing your own receivers, processors, and exporters. This can help you in integrating any Observability framework with any Observability providers that are available out there.

With all of these capabilities, you can receive, process, and publish your data in a vendor-agnostic way. Support for many frameworks and vendors is provided out of the box with a huge community rallying behind them. By adopting OpenTelemetry, you will be adopting many best practices based on knowledge from experts in the field.
While there are many best practices that you should follow in Observing your applications deployed in Kubernetes Clusters, OpenTelemetry Collector can help you in having a proper data publishing pipeline. If you are interested in learning more about other best practices related to Observability on Kubernetes, you can read more about it in the article I wrote on it (opens in a new tab).
OpenTelemetry is on its way to being used by almost everyone and I do not doubt that it will become even more widely adopted in the future. OpenTelemetry Collector alone provides many capabilities that will help you in your deployments.
So the next time you are designing the Observability data publishing pipelines for your Kubernetes Cluster, take a few minutes to ponder on whether the OpenTelemetry Collector can improve your deployment.
If you liked this article and would love to learn more about best practices on implementing, deploying, and maintaining applications on Kubernetes, read my article series Kubernetes the Right Way (opens in a new tab).