Reducing the Cloud Observability Expenses and Performance Impact
Observability is an essential aspect of any production environment, and at the same time, it can be a massive hit on the bottom line.
Read on Medium (opens in a new tab)
In this article, I’ll be sharing some valuable insights I gained from my experience leading a team of engineers and handling the technical aspects of the Observability area within a SaaS product. The focus will be on exploring various strategies to minimize expenses associated with application Observability. Drawing from my experiences and knowledge, I will primarily address a Kubernetes-based microservices architecture, but the majority of the content can be universally applied to any architecture or deployment.
The scope of the article is not to define best practices and is simply to articulate ways to reduce costs. However, you can read more about the best practices of Observability for Microservices deployed on Kubernetes in my article (opens in a new tab) on it.
Do We Need Observability? Can’t We Get Rid of It?

Observability consists of three main types of data (tracing, metrics, and logs), and it can give you a great view of the system, especially when you are trying to debug a problem in your application. While how Observability can help you and how to get the maximum out of it is out of the scope of this article, having it at any level can help you greatly in any production incident.
Because of that, even if you do not immediately see the use of Observability when everything’s working well, it will get a whole lot worse, when you get a problem and if you have no idea what’s happening in the system. This gets worse if you are dealing with a massive microservices architecture (for example on top of Kubernetes).
While Observability will give you a very good view into your system, you will still have to manage the costs associated with it. When you have a lot of activity in the system, it can get really out of hand, if it is not treated properly.
So, without further ado, let’s get started on how to reduce those pesky bills and the performance hits associated with Observability.
Use a Proper Trace Sampling Rate
Hopefully, your business is very successful and you have a large number of requests coming into your system. This is when the volume of tracing data may start to become a problem. Your solution is to use trace sampling. Even without having that issue, generally, I would recommend using sampling because collecting tracing data has an impact on performance.
The trace sampler will only record only some of the requests and the decision to do so will be passed on in the trace context. As mentioned above, this decision should ideally be taken at the very edge when a user’s request enters the system and everyone else in the system should simply follow the lead.
While there are many samplers available for you that you can use based on your needs, if you are unsure, I would recommend a rate-limiting sampler that will record a given n number of requests per second if there was any. This is better than a simple percentage-based sampler as the volume of collected tracing data does not increase, and at the same time guarantees that you have at least the n requests each second.
However, when there are intermittent issues that you wish to debug, you may also want to have a way to increase the sampling rate or even switch to recording everything temporarily. All of this needs to be done based on your needs and as a rule of thumb, it is always good to have a trace sampler in place.
Limit the Cardinality of Metric Attributes
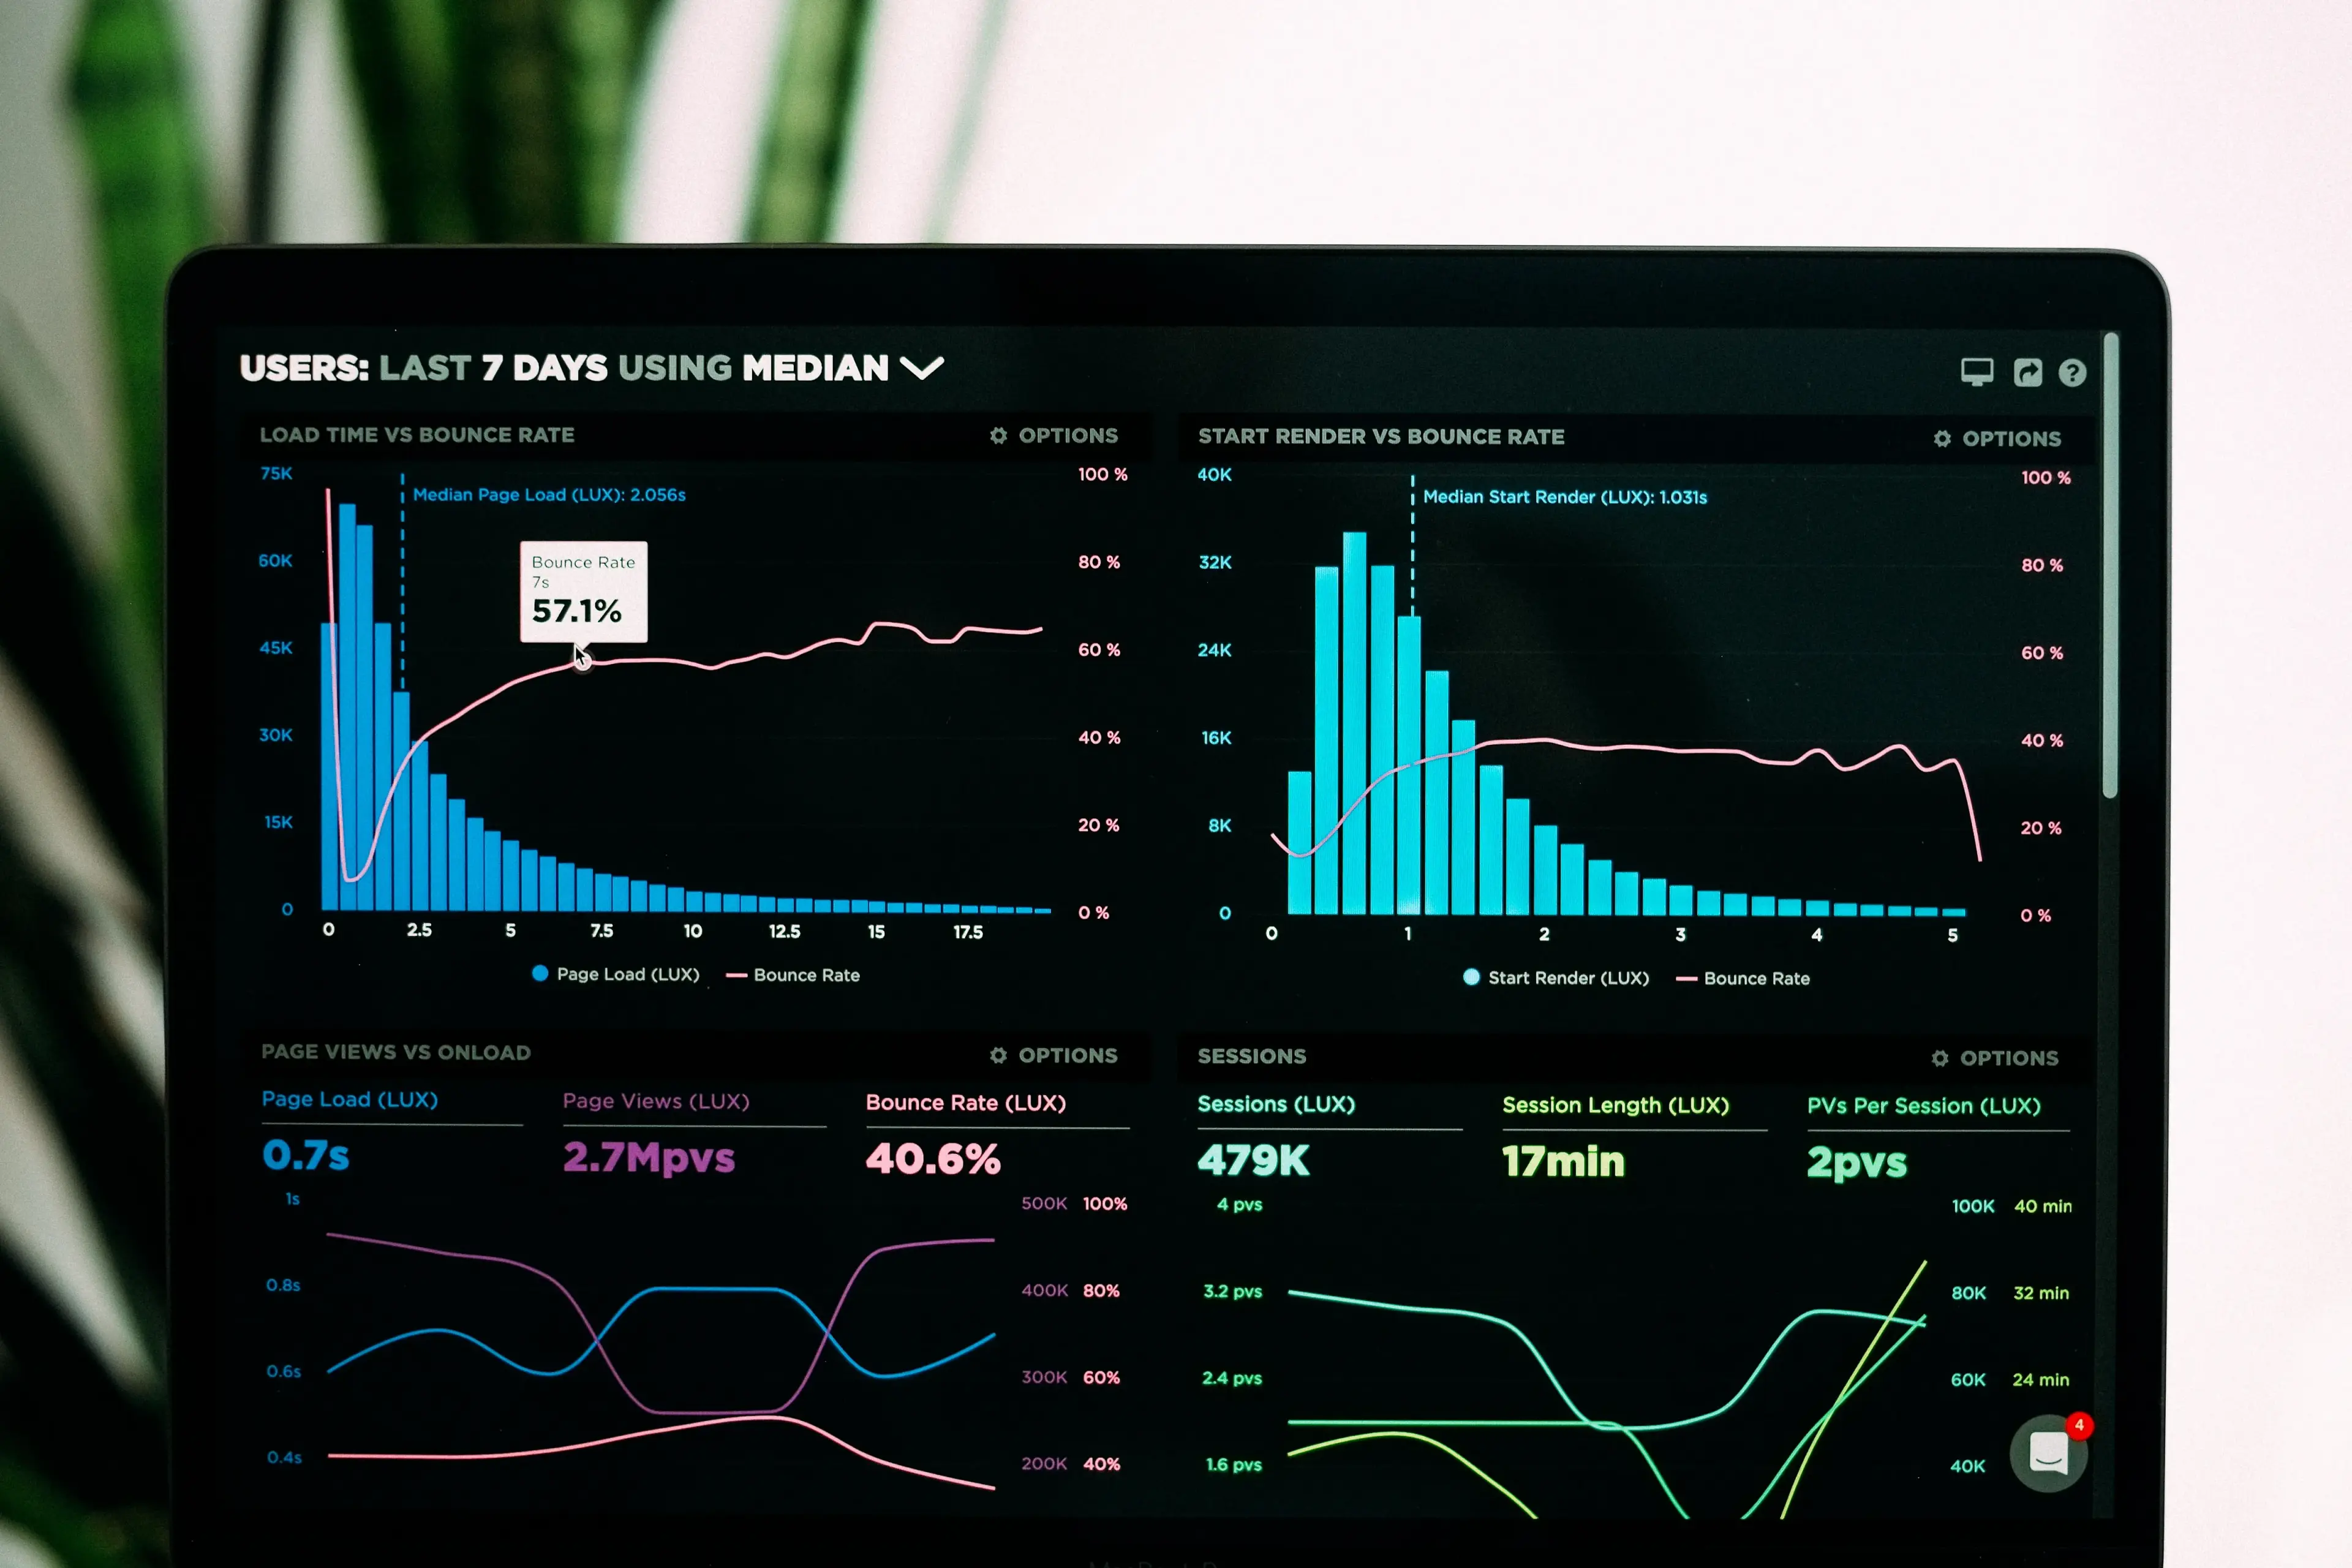
Another aspect, if not done right, that may impact your system performance as well as the cost is the metrics attributes (or tags). You would generally add multiple attributes for any metric and each of the attributes can have different values associated with them. The important aspect to remember here is that for each combination of different attribute values, a separate metric will be calculated.
For example, if you add something like the user ID to the metrics, there will be a separate metric calculated for each user. If you have hundreds or even millions of active users, the number of metrics calculated will also be multiplied by the same number, requiring more memory (to store the metrics) and more storage (for storing the Observability data). If you are using an Observability provider who is billing you for the ingested and stored data, this can get even worse.
With this problem in mind, you need to strike a proper balance between adding attributes and the costs associated with it. As a general rule, you should avoid any attributes with infinite cardinality altogether as they belong in tracing attributes only. You can even change some attributes to reduce cardinality while keeping the information loss minimal. For example, if you are trying to add the status code, you could add a status code group (2xx, 3xx, 4xx, 5xx) instead. This allows you to group metrics by failure types while keeping the impact less. In this manner, you should go over your attributes carefully and engineer them properly.
Adjust the Metrics Scrape/Publish Interval
Based on the Observability data collection model you have, you would generally have an interval at which you would get all the values from metrics recorders and save them to storage for future historical analysis.
While it may be enticing to do it more frequently, higher frequency also means that you would collect more data and pay more for it. At the same time, higher frequencies can lead to missing some interesting data points such as spikes in the metrics. While you can’t go too crazy with this to save costs, I would generally suggest an interval between 10 to 60 seconds, which you can choose based on your needs.
Have Proper Log Levels and the Ability To Change the Output Log Level
Another culprit in those large Observability bills is the logs generated by all the services. When this is not done right, you might end up with a large amount of logs and no proper way to reduce them, because logs are the most basic form of Observability.
By having proper log levels which do not print all the time and which can be enabled at any moment when there is a problem that needs to be investigated, you can have a balance between the two extremes. As a rule of thumb, try to move all the logs that are printed for all requests handled, to either debug or trace levels that are not printed by default. I have seen many people misuse the info log level for this purpose and that itself can cost you when the request rate into your application increases.
By properly categorizing error and warning log levels, you can even set up alarms to identify errors before frustrated users bring them to you as well. Overall, care should be taken to properly categorize your logs into different log levels and also to have an environment variable or some other form of configuration that can change the log level at any time in production.
Archive After a Proper Time Elapses
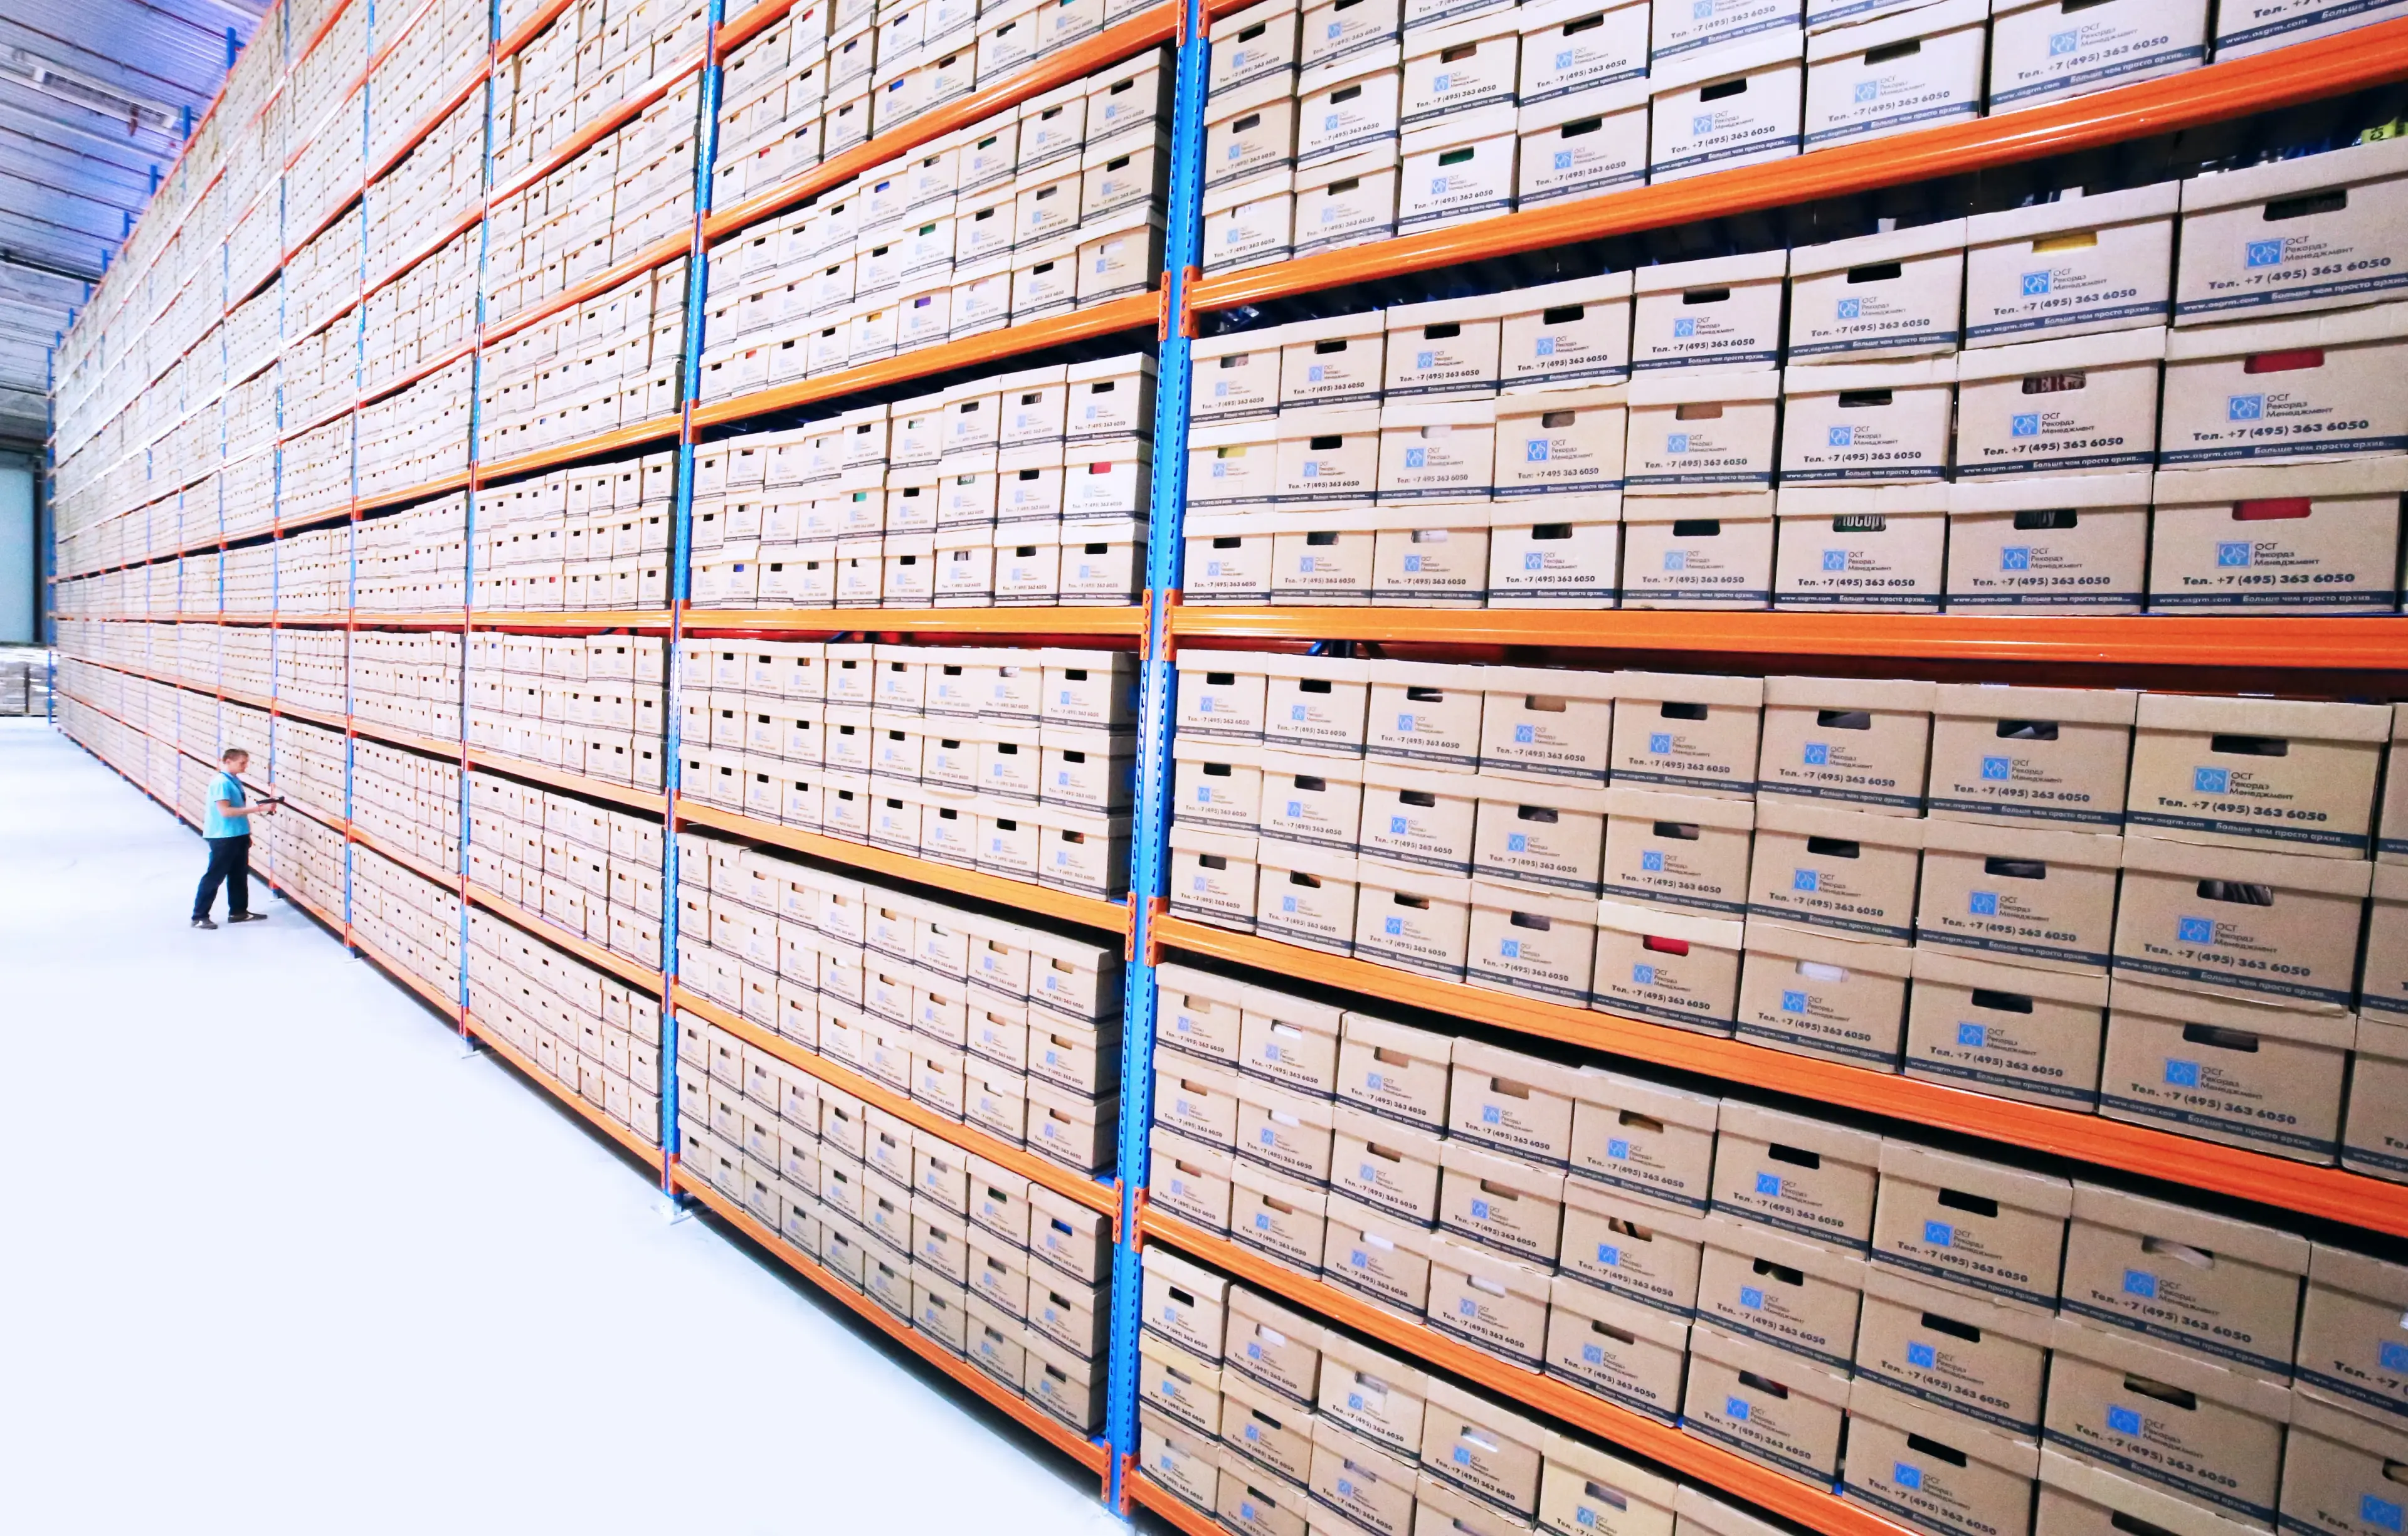
With time when you have been operating for a few years, you will still notice that the size of the total storage used by the Observability data increases due to the accumulated data over time that gets recorded and collected. To deal with these it is important to set up archival and deletion tasks/rules based on your needs.
Most Observability and storage providers would have this built in as a configuration and you just need to define when to perform these actions. You need to figure out the following timelines for your business and configure them appropriately.
- Archival — Generally, the archive level storages cost less for the storage size itself but cost more and take longer for the read, write, and delete operation done on them. So the main thing to consider is when the frequency of access almost dies down. Therefore check DevOps teams’ access patterns to identify this and it would generally fall between one to three months.
- Deletion — While you may like to delete your data after a few months, chances are that based on your business area and functionalities, you have legal requirements for keeping them for longer. This can even span up to five years or more based on the legal requirements. Even without them, I would recommend keeping them for about a year or so, so that you have a reference to look back on or even to investigate an issue that had been there for a long time. You could consider aggregating the past data before deleting it.
Even if you are not having this problem, it is best to have these defined from the start as most providers do not even require any payments to enable these. Even some of them would have sensible defaults on by value and you would need to simply tweak them.

In general Observability bill would take up a large part of your cloud bill, and you should think twice before pumping in more data into them. At the same time, the more data you have, the easier it gets to find a problem in your system. So strike a balance between them and identify any unnecessary data that you can remove, so that you have a great business running with less overhead.